When recording a lab, the process is about the same regardless of what you are experimenting on.
Your lab report should flow like a story; you should not have to “go back” and squeeze something in later.
In a general format, you will:
- Pre-lab: What is it you want to do, and what are your goals?
- Observe some sort of phenomenon.
- Develop (or be given) a challenge that you will work to answer.
- Procedural development
- Develop a procedure to answer your challenge.
- In most cases, we want to have only two variables change: one that you control and adjust, and one that you observe how it changes for each change in the controlled variable.
- Brainstorm (individually or with your group) possible procedures
- Brainstorming is an environment where no idea is discarded; you should record all suggestions.
- Reflect with others on procedures, and adjust your procedures based on hearing thoughts of others.
- Your final procedure should be clear to someone who reads it and doesn’t have you there to ask “what do you mean by this…”
- Be sure to include descriptions of the materials you will use.
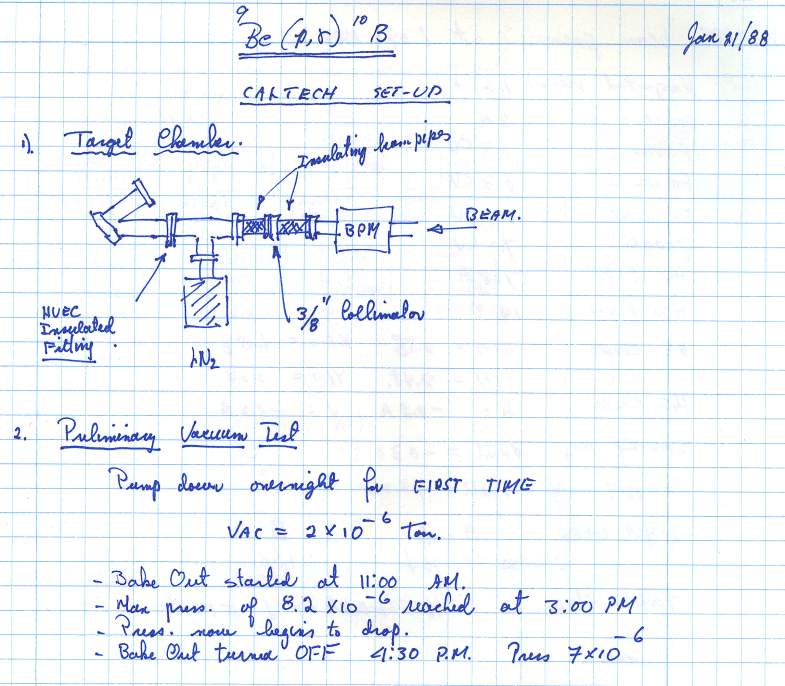
- Include some sketches of your setup.
- Include a data table for you to record your data.
- A good data table will speed up your data collection; you have thought ahead and are clear what you need to record.
- Develop a procedure to answer your challenge.
- Conduct the experiment and gather your data.
- Record your data in your data table as you collect it. It’s OK to have one person record the data, then everyone else ‘copy’ it after the lab is done, but be sure that everyone has the data before you leave for the day.
- As you record your data, also record observations that are not in your data table: If you found your procedures weren’t as easy to implement and you needed to make changes; if there are conditions that you think are important to match if you were to repeat the experiment; etc.
- Analyze your data
- Look for patterns in the changes you see.
- You may notice changes in sound volume, trends on your data plotted on a graph, color changes, etc.
- Describe the patterns.
- Look for patterns in the changes you see.
- Answer your initial questions/challenge
- Use the patterns you found to help.
- Give reasons why you provided your answer: Back it up with evidence!