2/20 PotU: More on earthquakes and tsunamis

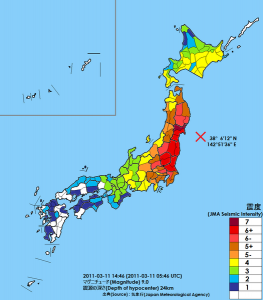
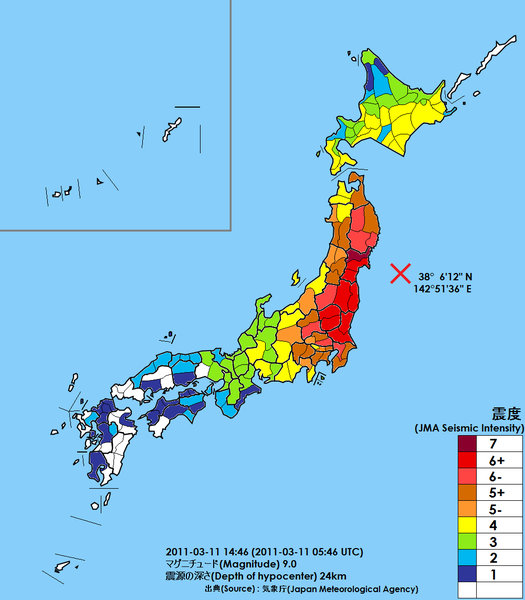
image showing earthquake strengths in Japan

Warm up

What is the name of the wave that was destructive after the Japanese earthquake? Are we at risk of a significant one if we have an earthquake on the San Andreas Fault?

Answer

There were two possible correct answers to this warm up:

(1) The Tsunami (a wave of ocean water) caused extreme damage to low-lying ares along the Japanese coast. At VHS, we are not at a significant tsunami at VHS because (a) Even through we are at a relatively low elevation, we are far from the ocean (the wave would have to come through the Golden Gate, then work its way up the Carquinez Straights, and (b) The San Andreas fault in California is a strike-slip fault, and these do not tend to cause large tsunamis.

(2) Some students answered the secondary wave, remembering that the primary waves tend to cause less damage than the primary waves. We are at risk of damage from secondary waves from earthquakes at VHS, but not nearly as much since we are further away from the fault.

Class work

Review earthquake/tsunami worksheet. Make sure you turn them in if you did not give to sum.

Note: The Richter scale is logarithmic, which basically means that for every number increase, the earthquake was ten times bigger. For example, a 7 is ten times bigger than a 6, and an 8 is 100 times bigger than a 6.
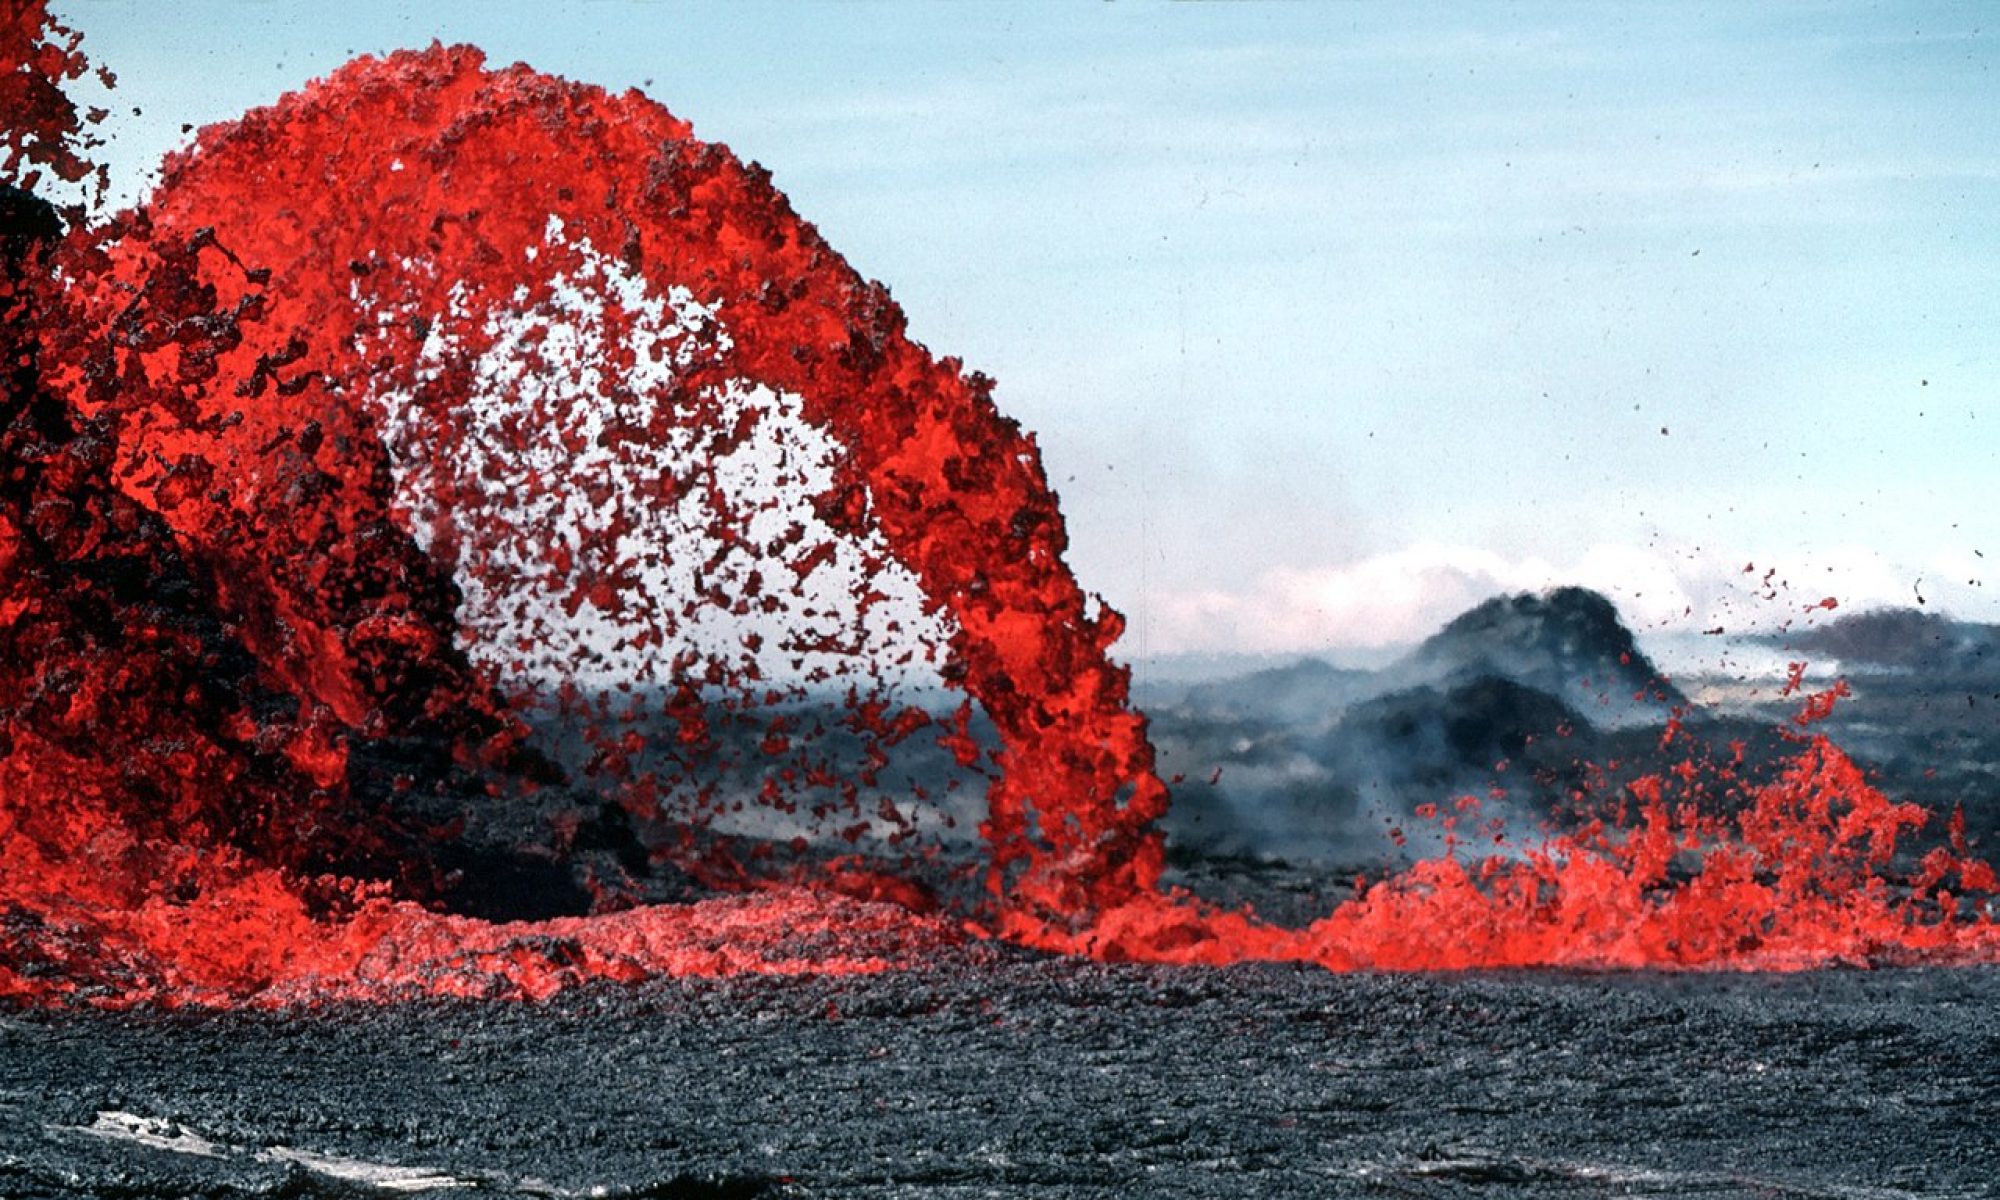
Short pseudoscience video

2/19 PotU: More about earthquakes

Warm up

Describe a tsunami, when they occur, and why they can be so destructive.

It looks like I’ll be back on Thursday. Still a rough throat, but the doc thinks I’ll be ready by then. I’ll probably have a wireless mic so I don’t have to strain my voice 😊 .

Today’s work

Read through the earthquake pamphlet and complete the worksheet. Remember to reflect on about both energy and waves as you complete the earthquake packet. That’s what earthquakes are all about.

Resources

Reading pamphlet

Worksheet

PDF Loading...

2/18 PotU: Japan’s Killer Quake, March 11, 2011

Warm Up

Which has more momentum? A huge truck stopped in the parking lot or a bee flying towards you? Explain why.

Classwork

Today and tomorrow and tomorrow we will look at earthquakes.

Today’s video: Japan’s Killer Quake, by NOVA

Https://www.pbs.org/wgbh/nova/videos/japans-killer-quake

As you watch this video, please hold in your hearts the 230,000 people who died from the earthquake and tsunami.

Worksheet assignment

PDF Loading...

Other notes from today’s video

image showing strength of 2011 Tohoku earthquake
  • Earthquake ‘P’ waves travel about 1-14 km/sec.
    • P stands for primary since they arrive first.
    • These waves are longitudinal/compressional waves.
  • ‘S’ waves travel at about 1-8 km/s, and are the more damaging ones.
    • S stands for shear, but also for secondary (since the arrive second)
    • These waves are transverse waves.
  • The earthquake struck about 60 miles off the coast.
  • Warnings on all cell phones across Japan. The US is developing this warning system for the west coast.
  • In the nuclear power plant that was damaged, nuclear energy (stored in uranium) is converted to thermal energy, then to kinetic energy, then to electrical energy.
  • Waves reach Tokyo 100 seconds after the Quake, city had one minute warning. Earthquake lasted for five minutes in Tokyo
  • Liquefaction is when moisture in earth is compressed and squeezed out–sort of like squeezing a sponge.
  • Tsunami was about 3 feet high, 60 miles in length.
  • Tsunami can travel over 500 MPH.
  • In the ocean, the wave is not ‘cresting.’ Just like normal waves, they usually crest as they reach short.
  • Wavelength of the tsunami was long.
  • ‘Miyaku’s high walls are useless’ True or not true?
    • Land dropped up to three feet in some places. This made the walls less useful, but it still decreased the damage.
  • Tsunami waves retreat, just like regular ocean waves, and when they do the pull people and debris out with it.
  • Tsunami reached Hawaii and surged for over an hour. Wave strong enough to cause major damage, but tsunami warning system allowed people to evacuate.
  • As tsunami spreads, energy spreads out and so any particular location receives less energy. Circumference of a circle is 2 π r, so if the tsunami travels 2 times as far, it’s twice as powerful at any one given point on that new circle.
  • Aftershocks are less than the original earthquake, but some reach 6.2 since the initial Quake was 9.0.
  • Japan’s latitude is about equal to Northern California.
  • Formation of hydrogen gas (from water, also creates oxygen), lead to explosions that opened the containment buildings.
  • ‘Read to go’ in geologic time can be one second or 100 years.
  • Along the west coast, from Washington State to Northern California (near Eureka), the Cascadia fault is a ‘subduction fault’ like that in Japan.
  • The rest of California has the San Andreas Fault, which is a ‘strike-slip’ or ‘transverse’ fault; the magnitude of earthquakes on these types of faults is about 10 times less than subduction faults.
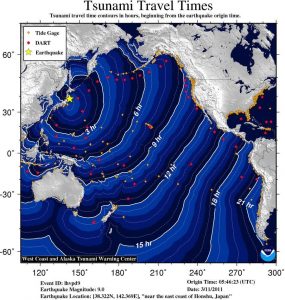
image showing tsunami travel times across the Pacific Ocean

Videos of the tsunami reaching North America

Richmond in the SF Bay
Santa Cruz
Crescent City
Morro Bay

2/12 PotU: Momentum with Bill Nye

photo showing cue ball breaking a triangle of billard balls

Warm up

What has more momentum? A 2,000 kg car moving 10 m/s or a 1,500 kg car moving at 15 m/s?

Show the math you used in your warmup sheet.

I should be back tomorrow, so one more day of video. Please complete the worksheet as you watch the movie. You may ask your sub to pause the video when you need time to complete a line.

When you are done with the video, take any extra time to complete yesterday’s work. Turn in today’s video notes sheet as well as yesterday’s work before you leave.

Today’s video

If the video below isn’t Bill Nye SO2E17 Momentum, please reload this page to get the correct video.

https://youtu.be/X-czMvI65dY

Video questions handout

File Name: Bill-Nye-Momentum-Video-Questions-Trampleasure.pdf

PDF Loading...

2/10 PotU: More energy

image showing three energy bar charts and a system box

Hi all. I’m out for another day or two (extreme sore throat, no, not caronavirus!)

Warm up

Draw an energy bar chart set for the mousetrap car as it goes from (1) fully wound up to (2) moving across the floor and finally (3) stopped on the floor.

image showing three energy bar charts and a system box

Today you will have a reading and worksheet to practice on energy and working. Hopefully I’ll be back tomorrow so we can start on the mousetrap cars.

If you do not complete today’s assignment in class (it’s a shorter day), please complete it for homework.

2/7 PotU: Designing your mousetrap car

cover image for mousetrap car video

Warm up

Using physics, explain why the first hill on a roller coaster always the highest.

Designing your mousetrap car

Next week you will build, test, and the mousetrap car. As you build it, you will also determine the work done by the mousetrap spring by measuring the force and distance the mousetrap arm moves.

Watch the following videos, and take notes about ideas that techniques you may use for your car (we will start with materials on Monday).

Record your notes in today’s exit ticket area and the “Three things I learned this week” section of your bookends sheet.

Before you leave today, turn in your bookends sheet (make sure your name is on it!)

Homework

Start thinking about how you might customize your mousetrap car. Each group will receive the following items, extras are are up to you. If you want to use special materials, collect them over the weekend so you can use them on Monday.

  • One small mousetrap (larger rat traps are not allowed)
  • A light board about 8″ long by 3″ wide (you may replace this if you prefer a different design)
  • Dental floss or similar string
  • One set of plastic wheels with axle
  • One pair of CDs
  • Hot glue
  • Paint stirrer stick (two lengths available), to extend your mousetrap bar and tie your string to.

More videos you might want to view

Another video showing many student-built mousetrap cars.

2/6 PotU: Video review for energy transformations and forces

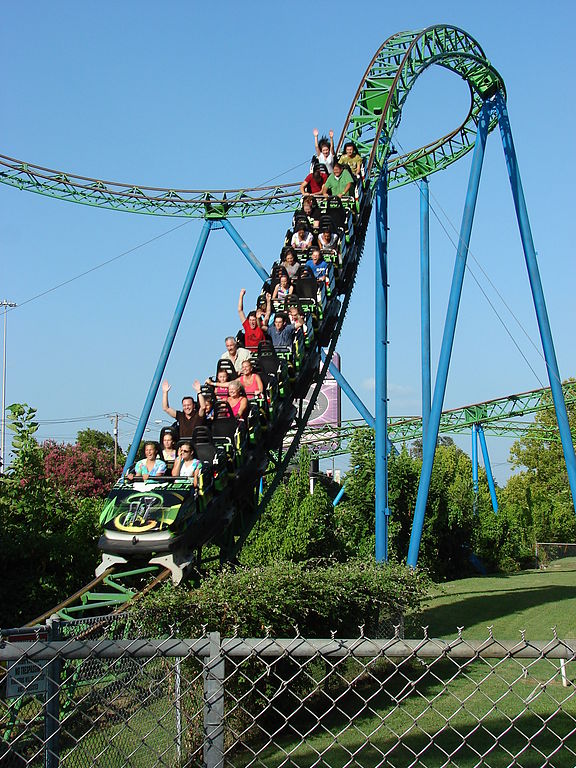
photo showing riders on a roller coaster going down a steep hill

Warm up

Sketch the following roller coaster, then draw energy bar charts for Position A, B, and C.

image showing roller coaster with A at the top of a hill, B at the top of the the second, lower, hill, and C and D along a flat portion lower than the second hill.

No stamp today, but you will get credit for completing the warmup section for today.

Lesson

Video day. What the main video and answer the questions on the handout. You may ask the sub to pause the video if you need time to complete lengthier questions.

https://youtu.be/H3UQiuDej38

File Name: Roller-Coaster-Physics-video-notes.pdf

PDF Loading...

Other energy videos you may enjoy

Is energy conserved on a galactic scale? Watch the videos below:

2/5 PotU: Kinetic and gravitational energy practice

photo showing riders on a roller coaster going down a steep hill

Hi all. I’m out sick today, so we’ll have to put off mousetrap cars. Today you’ll have some more practice with calculating kinetic energy.

Honors students, you’ll work with a new equation for gravitational potential energy in the second worksheet.

Documents

File Name: gpe-word-problems.pdf

PDF Loading...

File Name: kinetic_and_potential_energy_worksheet.pdf

PDF Loading...

1/30 PotU: Waves math

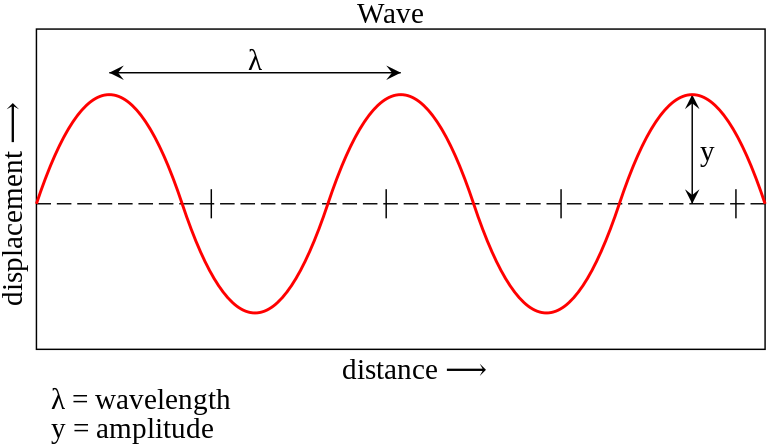
Image of a wave showing wavelength, distance and amplitude

From the Waves on a String packet, we were able to develop the wave equation:

speed = wavelength x frequency

or, using symbols:

s = λ x f

Units for each variable are:

  • speed in m/s
  • wavelength in meters
  • frequency in Hz (‘Hertz’)

Measurements of a wave are shown below.

Image of a wave showing wavelength, distance and amplitude
Wave properties and how to measure them.

Today’s practice worksheet

PDF Loading...