2/6 AP: Collecting momentum data

Image showing carts and photogates

Yesterday

Yesterday you had time to develop your skills at collecting data with the Vernier Photogates and/or Motion sensor. Today it’s time to collect the data.

Today

Review your lab goals and procedures from Tuesday’s description. Your goal today is to collect pre- and post- collision data for both of your carts in four different variations (e.g. changing the mass, changing the velocity, changing the direction of the cars).

Data collection

Image showing carts and photogates
  • Set up your ramp so you can record the data both before and after the collision.
  • Before you start collecting data, make a bullet list of all the variables you will measure. Include the following for each variable:
    • where you will find that number (on what device)
    • the units for each measurements
    • the uncertainty of each measurement (remember that with digital readouts, we assume ±1 of the lowest decimal place provided by the measuring device).
  • Create a data table in your lab book, including three trials for your four different collision types.
  • Collect your data, then enter it into a Google or Excel spreadsheet (we will want to do more processing of the data than Desmos can handle, although you may want to ‘copy and paste’ the data into Desmos later for plotting).
  • After you have completed collecting data for your four collisions, start with your explosion data collection if you have time.
2/5 AP: Tips on Vernier photogates

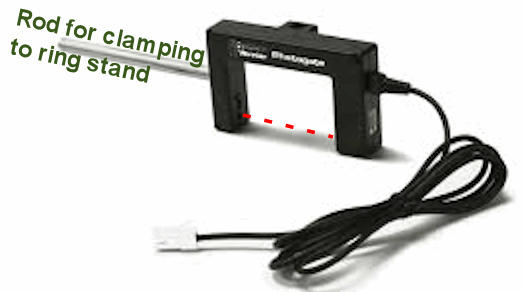
Phhoto of Vernier photogate

Tips to support data collection for yesterday’s lab.

Photogates

Phhoto of Vernier photogate

The Vernier Photogates use a beam of light to detect objects between the two ‘arms.’ LoggerPro identifies the gate state as “Open” or “Closed.”

  • Open implies that nothing is blocking the light beam
  • Closed implies there is something blocking the light beam.

In most cases, we want to know the time that the gate is closed.

Determining the speed of an object that passes through the photogate

Attach a photogate to a ringstand, then adjust it so a flag mounted on your cart will break the beam of light.

Measure the length of the object that will pass through photogate. When the object passes through the photogate, it measures how long the beam is blocked. The object’s speed (at the position of the photogate) is determined by dividing the length of the object by the blocked time.

This video should walk you through setting up Logger Pro for ‘gate timing.’ The interface she uses different than our LabQuest Mini, but the sensor set up should be the same.

Remember that you will need to attach both photogates, so you can get the velocity of each cart.

More detailed information on the photogates can be found on Vernier’s website.

Here’s a video with more deep background on how the Photogate works.