Learning objectives
The student is able to describe and make qualitative and/or quantitative predictions about everyday examples of systems with internal potential energy. (Science Practices 2.2, 6.4, and 7.2)
Introduction
Observe the demonstration and take notes on your observations and questions. Think about/answer the following questions:
- If the track were steeper or shallower, how would the motion change? Justify your answer using your knowledge of kinematics and energy.
- Short answer on our own (2 minutes).
- Expand answer with our group (3 minutes) .
- Expand answer with the class (5 minutes) .
Equipment
- Low friction cart
- Ramp
- Meterstick
- Stopwatch
- Assorted masses
Tools

- Calculator
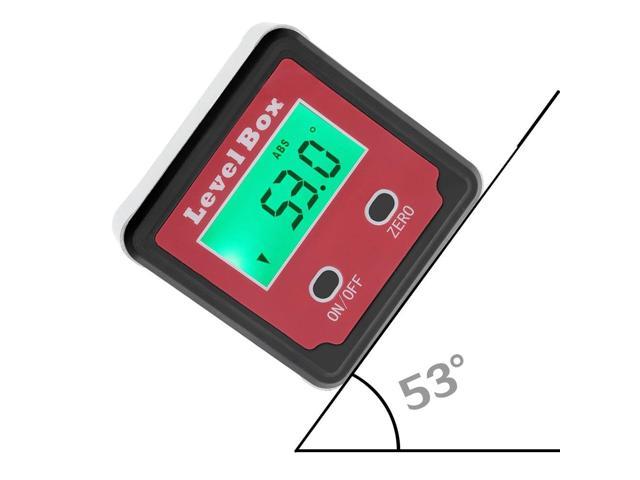
- Clinometer to measure angle of ramp
- Whiteboard for sharing group work
- Books or other objects to change the steepness of the track
Safety
- Please keep carts on tables to prevent people from slipping on them (or damaging them).
- The carts have spring plungers; make sure they aren’t compressed near delicate parts of your body, or breakable objects.
- Think and be careful
Design and conduct an experiment to answer the following question.
- If the track were steeper or shallower, how would the motion change? Justify your answer using your knowledge of kinematics and energy.
Keep focused on your objective!
Provide detailed procedural steps. Make sure that if you gave them to someone who had not completed the lab, they could do everything completely and in the same way your group did it.
Why are you doing each step, and what are reasonable measurements.
Are you completing these steps as you progress?
- Prelab notes
- Title
- Purpose
- Personal procedures/ideas
- Group procedures/ideas/notes
- Class procedures/ideas/notes
- Data table
- Notes on experiment from as you conduct it.
- Scatter plot or other visual analysis of data.
- Processing/analyzing data:
- Group conclusion (what can your group conclude, without looking at other groups’ data?)
- Whiteboard notes
- Class data comparison and conclusions.
