Assignment: Take notes as you go through this section, then submit a copy of your notes.
Overview

The atmosphere is layered, corresponding with how the atmosphere’s temperature changes with altitude. By understanding the way temperature changes with altitude, we can learn a lot about how the atmosphere works. While weather takes place in the lower atmosphere, interesting things, such as the beautiful aurora, happen higher in the atmosphere. Why does warm air rise? As energy is added, and the air heats up, its kinetic energy increases (the molecules speed up) and they bounce off each other and take up more space.
- When gas molecules are cool, they are sluggish and do not take up as much space. With the same number of molecules in less space, both air density and air pressure are higher.
- When gas molecules are warm, they move vigorously and take up more space. Air density and air pressure are lower.
Warmer, lighter air is more buoyant than the cooler air above it, so it rises. The cooler air then sinks down, because it is denser than the air beneath it. This is convection, which was described in the Plate Tectonics chapter.
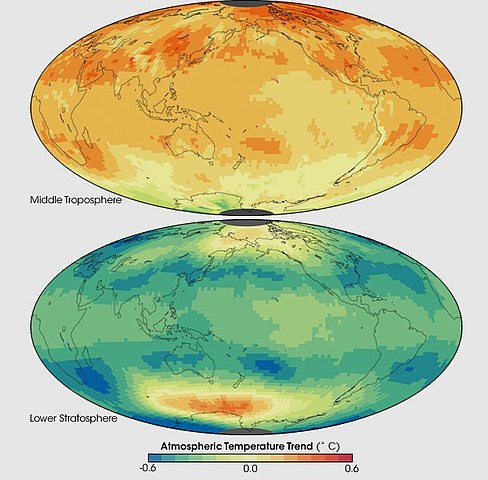
The property that changes most strikingly with altitude is air temperature. Unlike the change in pressure and density, which decrease with altitude, changes in air temperature are not regular. A change in temperature with distance is called a temperature gradient.
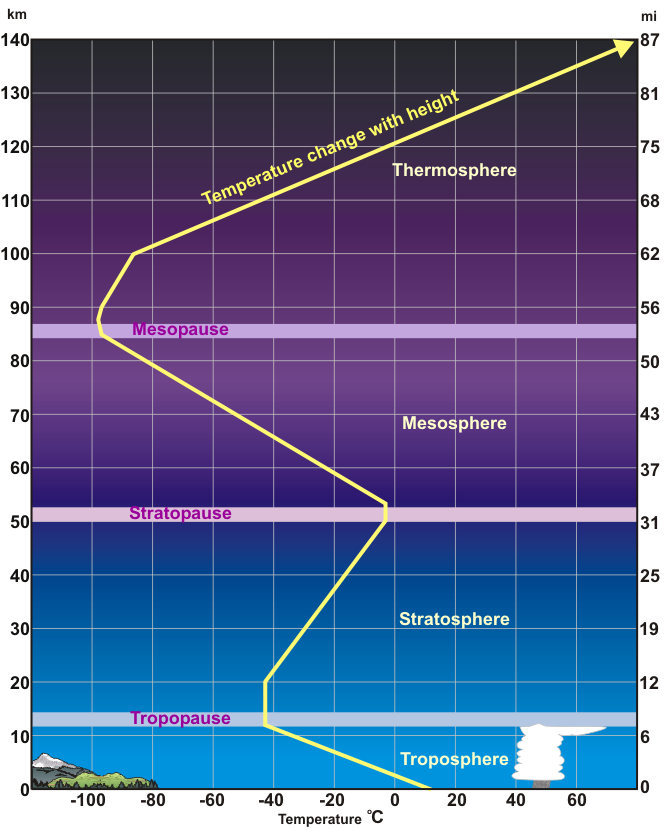
The atmosphere is divided into layers based on how the temperature in that layer changes with altitude, the layer’s temperature gradient. The temperature gradient of each layer is different. In some layers, temperature increases with altitude and in others it decreases. The temperature gradient in each layer is determined by the heat source of the layer. Most of the important processes of the atmosphere take place in the lowest two layers: the troposphere and the stratosphere.

Energy transfers in the atmosphere
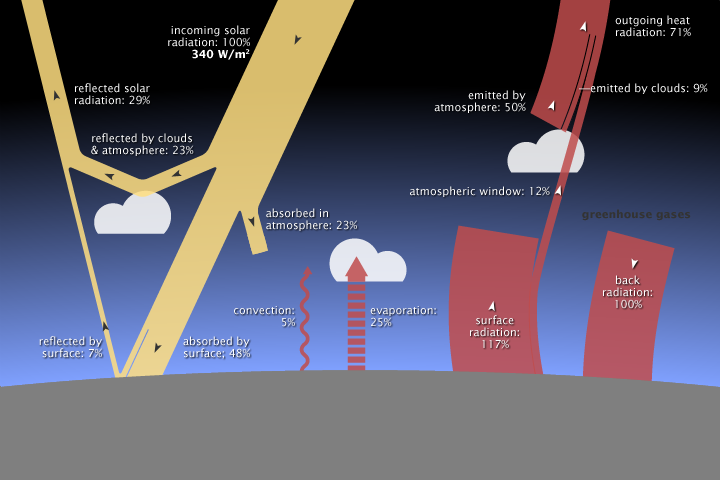
In the diagram above: Follow the yellow arrows to see the path of incoming solar radiation (light, x-rays, ultraviolet, etc.). The red arrows show the path of infrared energy that is created when the incoming radiation interacts with particles in the atmosphere or on the earth.
On average, 340 watts per square meter of solar energy arrives at the top of the atmosphere. Earth returns an equal amount of energy back to space by reflecting some incoming light and by radiating heat (thermal infrared energy). Most solar energy is absorbed at the surface, while most heat is radiated back to space by the atmosphere. Earth’s average surface temperature is maintained by two large, opposing energy fluxes (a flux is a change/flow) between the atmosphere and the ground—the greenhouse effect. NASA illustration by Robert Simmon, adapted from Trenberth et al. 2009, using CERES flux estimates provided by Norman Loeb.)
Temperature-based layers
Troposphere (about 0-10 km)
Tropo means change. The troposphere is where about all of our weather occurs, so there is a lot of change in the troposphere.
The temperature of the troposphere is highest near the surface of the Earth and decreases with altitude.
On average, the temperature gradient of the troposphere is 6.5 °C per 1,000 m (3.6 °F per 1,000 ft.) of altitude. What is the source of heat for the troposphere?
Earth’s surface is a major source of heat for the troposphere, although nearly all of that heat comes from the Sun. Rock, soil, and water on Earth absorb the Sun’s light and radiate it back into the atmosphere as heat. The temperature is also higher near the surface because of the greater density of gases. The higher gravity causes the temperature to rise.

Notice that in the troposphere warmer air is beneath cooler air. What do you think the consequence of this is? This condition is unstable. The warm air near the surface rises and cool air higher in the troposphere sinks. So air in the troposphere does a lot of mixing. This mixing causes the temperature gradient to vary with time and place. The rising and sinking of air in the troposphere means that all of the planet’s weather takes place in the troposphere.
Sometimes there is a temperature inversion, air temperature in the troposphere increases with altitude and warm air sits over cold air. Inversions are very stable and may last for several days or even weeks. They form:
- Over land at night or in winter when the ground is cold. The cold ground cools the air that sits above it, making this low layer of air denser than the air above it.
- Near the coast where cold seawater cools the air above it. When that denser air moves inland, it slides beneath the warmer air over the land.
Since temperature inversions are stable, they often trap pollutants and produce unhealthy air conditions in cities. At the top of the troposphere is a thin layer in which the temperature does not change with height. This means that the cooler, denser air of the troposphere is trapped beneath the warmer, less dense air of the stratosphere. Air from the troposphere and stratosphere rarely mix.
Stratosphere (about 10-30 km)
Starto means spreading out. This is a region where air particles are very spread out.
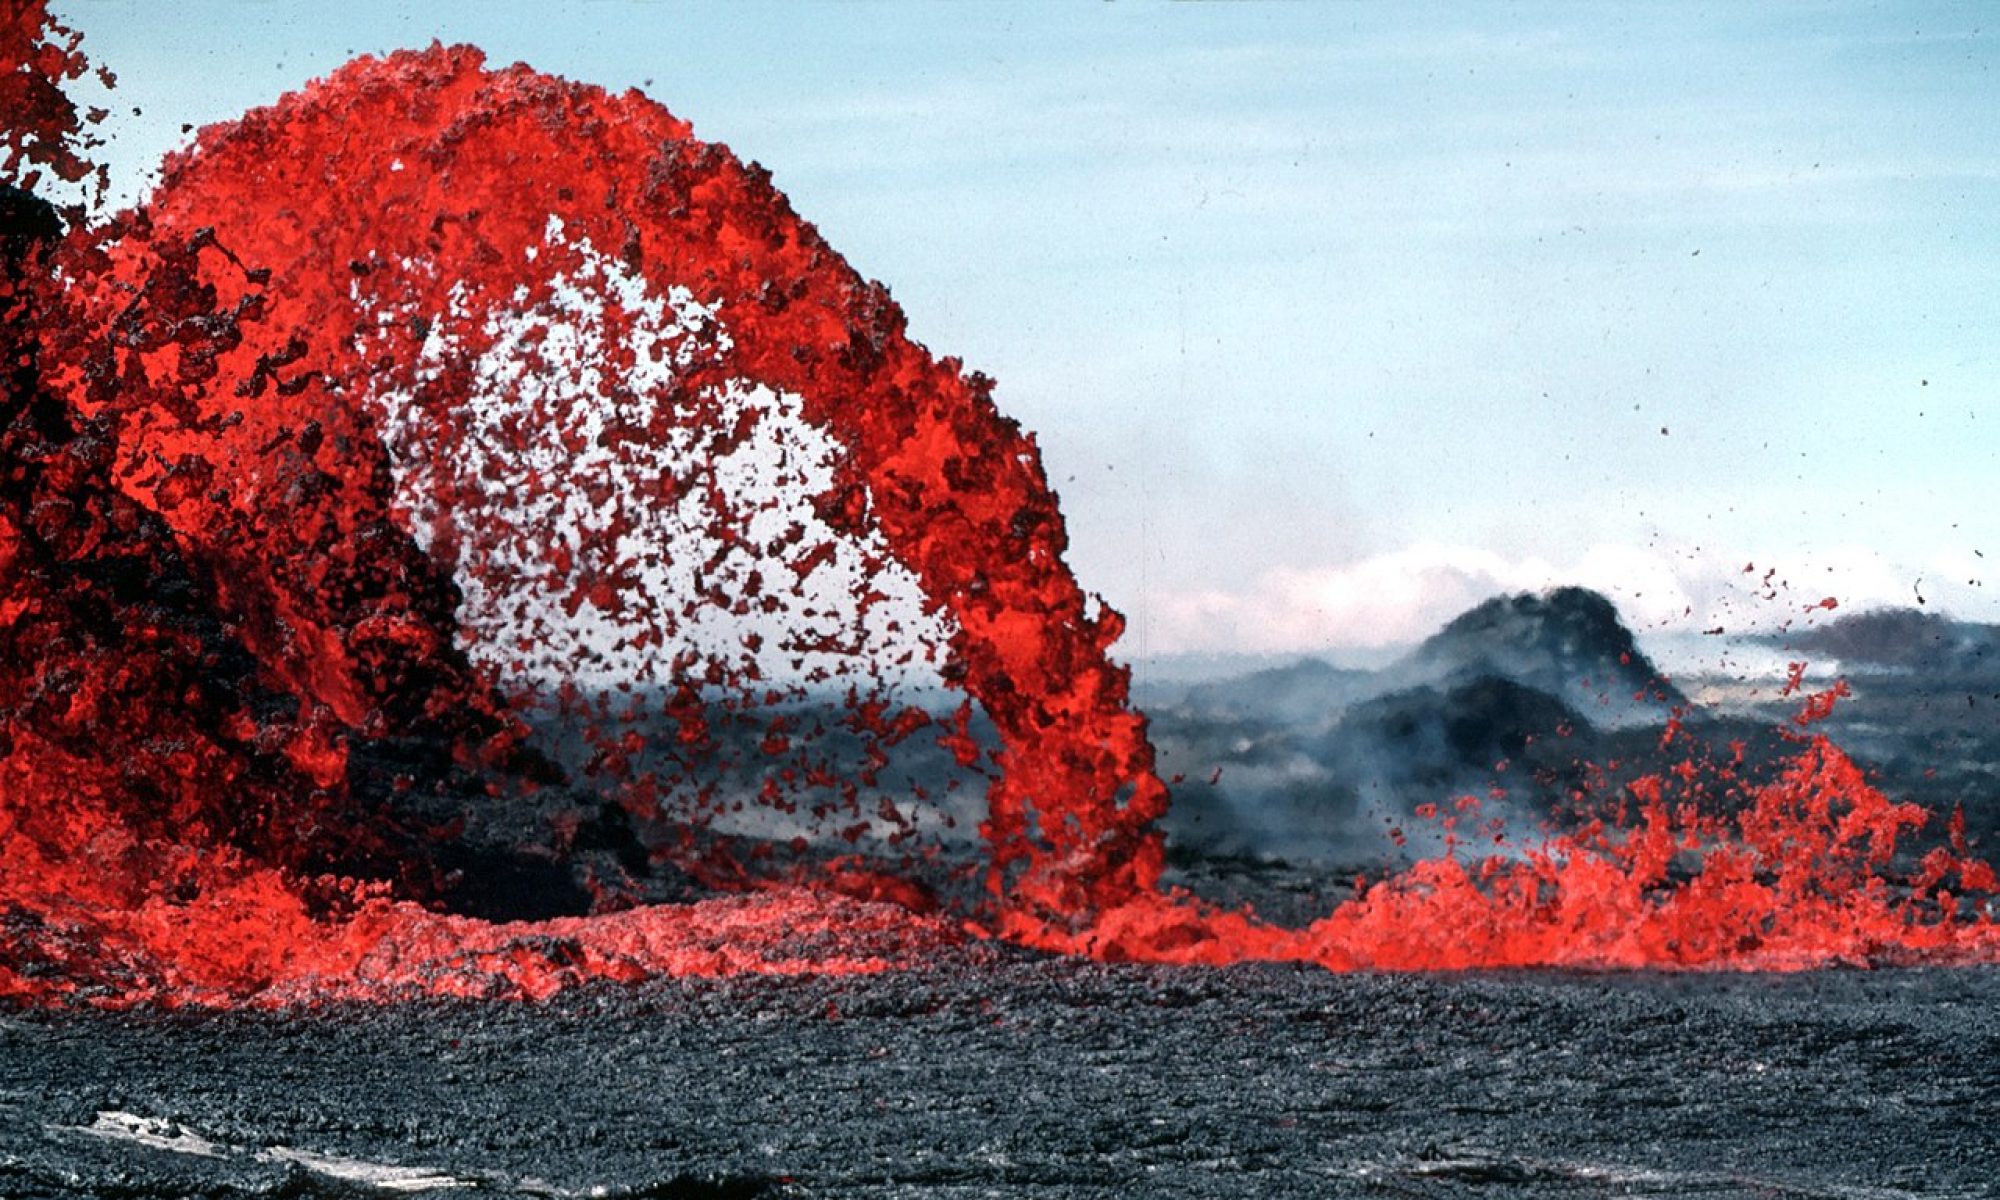
Ash and gas from a large volcanic eruption may burst into the stratosphere, the layer above the troposphere. Once in the stratosphere, it remains suspended there for many years because there is so little mixing between the two layers. Pilots like to fly in the lower portions of the stratosphere because there is little air turbulence.

In the stratosphere, temperature increases with altitude. What is the heat source for the stratosphere? The direct heat source for the stratosphere is the Sun. Air in the stratosphere is stable because warmer, less dense air sits over cooler, denser air. As a result, there is little mixing of air within the layer.

The ozone layer is found within the stratosphere between 15 to 30 km (9 to 19 miles) altitude. The thickness of the ozone layer varies by the season and also by latitude. The ozone layer is extremely important because ozone gas in the stratosphere absorbs most of the Sun’s harmful ultraviolet (UV) radiation. Because of this, the ozone layer protects life on Earth. High-energy UV light penetrates cells and damages DNA, leading to cell death (which we know as a bad sunburn). Organisms on Earth are not adapted to heavy UV exposure, which kills or damages them. Without the ozone layer to reflect UVC and UVB radiation, most complex life on Earth would not survive long.
Mesosphere (about 30-50 km)
Meso means middle. It is about in the middle of the atmosphere.
Temperatures in the mesosphere decrease with altitude. Because there are few gas molecules in the mesosphere to absorb the Sun’s radiation, the heat source is the stratosphere below. The mesosphere is extremely cold, especially at its top, about −90 degrees C (−130 degrees F).
The air in the mesosphere has extremely low density: 99.9 percent of the mass of the atmosphere is below the mesosphere. As a result, air pressure is very low. A person traveling through the mesosphere would experience severe burns from ultraviolet light since the ozone layer which provides UV protection is in the stratosphere below. There would be almost no oxygen for breathing. Stranger yet, an unprotected traveler’s blood would boil at normal body temperature because the pressure is so low.
Thermosphere (about 50-500 km)
Thermo means heat. The thermosphere has the hottest gases in the atmosphere.
The density of molecules is so low in the thermosphere that one gas molecule can go about 1 km before it collides with another molecule. Since so little energy is transferred, the air feels very cold. Within the thermosphere is the ionosphere. The ionosphere gets its name from the solar radiation that ionizes gas molecules to create a positively charged ion and one or more negatively charged electrons. The freed electrons travel within the ionosphere as electric currents. Because of the free ions, the ionosphere has many interesting characteristics. At night, radio waves bounce off the ionosphere and back to Earth. This is why you can often pick up an AM radio station far from its source at night.

The Van Allen radiation belts are two doughnut-shaped zones of highly charged particles that are located beyond the atmosphere in the magnetosphere. The particles originate in solar flares and fly to Earth on the solar wind. Once trapped by Earth’s magnetic field, they follow along the field’s magnetic lines of force. These lines extend from above the equator to the North Pole and also to the South Pole then return to the equator.
When massive solar storms cause the Van Allen belts to become overloaded with particles, the result is the most spectacular feature of the ionosphere—the nighttime aurora. The particles spiral along magnetic field lines toward the poles. The charged particles energize oxygen and nitrogen gas molecules, causing them to light up. Each gas emits a particular color of light.
Other layers; not based on temperature
Ozone layer (about 15-35 km)
The ozone layer or ozone shield is a region of Earth‘s stratosphere that absorbs most of the Sun‘s ultraviolet radiation. It contains high concentration of ozone (O3) in relation to other parts of the atmosphere, although still small in relation to other gases in the stratosphere. The ozone layer contains less than 10 parts per million of ozone, while the average ozone concentration in Earth’s atmosphere as a whole is about 0.3 parts per million. The ozone layer is mainly found in the lower portion of the stratosphere, from approximately 15 to 35 kilometers (9.3 to 21.7 mi) above Earth, although its thickness varies seasonally and geographically.[1]
From Wikipedia: Ozone Layer
Exosphere (higher than 500 m)
Exo means outside. The exosphere is the outermost layer of the atmosphere.
There is no real outer limit to the exosphere, the outermost layer of the atmosphere; the gas molecules finally become so scarce that at some point there are no more. Beyond the atmosphere is the solar wind. The solar wind is made of high-speed particles, mostly protons and electrons, traveling rapidly outward from the Sun.
There is no real outer limit to the exosphere, the outermost layer of the atmosphere; the gas molecules finally become so scarce that at some point there are no more. Beyond the atmosphere is the solar wind. The solar wind is made of high-speed particles, mostly protons and electrons, traveling rapidly outward from the Sun.
Ionosphere (about 60-1,000 km)
The ionosphere is the ionized part of Earth’s upper atmosphere, from about 60 km (37 mi) to 1,000 km (620 mi) altitude, a region that includes the thermosphere and parts of the mesosphere and exosphere. The ionosphere is ionized by solar radiation. It plays an important role in atmospheric electricity and forms the inner edge of the magnetosphere. It has practical importance because, among other functions, it influences radio propagation to distant places on the Earth.[3]
From Wikipedia: Ionosphere
Optional: Other resources if you’d like to see more.
- Layers of Earth’s Atmosphere, from UCAR Center for Science Education
- PhET Greenhouse Effect simulation (requires Java, so may not run on many devices)
- Bozeman Science: The Atmosphere (12 minute video)
- Where Does Space Start? (17 minute video)
Upload a copy of your notes
Upload a copy of your notes by following this link.
Licenses and Attributions
Source of document
Revised from Layers of the Atmosphere, in Lumen Physical Geography.
CC licensed content, Shared previously
- Dynamic Earth: Introduction to Physical Geography. Authored by: R. Adam Dastrup. Located at: http://www.opengeography.org/physical-geography.html. Project: Open Geography Education. License: CC BY-SA: Attribution-ShareAlike
All rights reserved content
- Temperature Inversion – Cool Science Experiment. Authored by: Sick Science!. Located at: https://youtu.be/LPvn9qhVFbM. License: All Rights Reserved. License Terms: Standard YouTube License
- Layers of the Atmosphere-Hommocks Earth Science Department. Authored by: metfan869. Located at: https://youtu.be/S-YAKZoy1A0. License: All Rights Reserved. License Terms: Standard YouTube License
Public domain content
- Standardized Temperature Profile. Provided by: Weather.gov. Located at: http://forecast.weather.gov/jetstream/atmos/atmprofile.htm. License: Public Domain: No Known Copyright
- Cumulonimbus Cloud over Africa. Provided by: NASA. Located at: https://commons.wikimedia.org/wiki/File:Cumulonimbus_Cloud_over_Africa_(color).jpg. License: Public Domain: No Known Copyright
- Endeavour silhouette. Provided by: NASA. Located at: https://www.nasa.gov/multimedia/imagegallery/image_feature_1592.html. License: Public Domain: No Known Copyright
- Aurora Australis Observed from the International Space Station. Provided by: NASA. Located at: https://earthobservatory.nasa.gov/IOTD/view.php?id=44348. License: Public Domain: No Known Copyright